
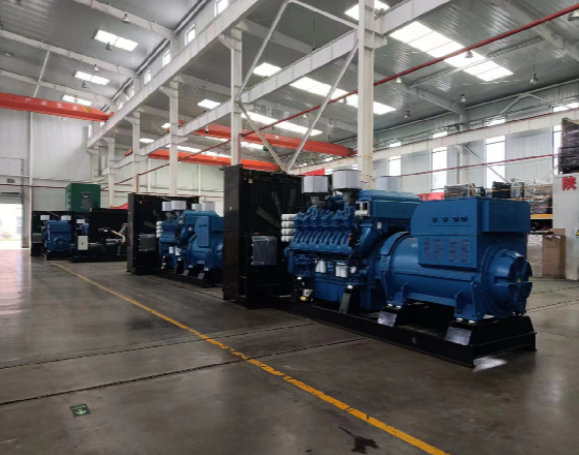
Why transient load response matters right now
Modern data centers in Northern Virginia and Silicon Valley face steep penalties for even brief power hiccups: server racks trip, cooling cycles stall, and service-level agreements bite. The core problem is not steady-state power — it’s the sudden swings when racks bring hundreds of kilowatts online or when large UPS systems transfer. Engineers model those swings against a certified 3 MW generator to make sure the plant doesn’t stall or overreact. Part of that modeling starts small; think equipment like a 45 kva generator used in auxiliary testing and load-bank runs.
Concrete steps engineers take to calculate transient response
First, quantify the worst-case events: maximum inrush current from new servers, simultaneous cooling compressor starts, and UPS transfer timing. Then build a composite transient profile — a time series of kW and kVAR changes at millisecond-to-second resolution. From there, you test the generator’s governor and AVR tuning against that profile using a load bank and step tests. The math mixes simple differential equations for engine speed with empirical response curves measured during factory acceptance tests. The result is a set of trip points and governor deadband settings that keep the generator within safe frequency and voltage windows.
Key components and the role each plays
Generators are a system: engine, alternator, governor, AVR, and transfer switch. The alternator’s short-circuit reactance and the engine’s torque curve determine how much voltage dip and frequency sag you’ll see during a step load. That’s why measuring alternator behavior matters — and why a tested single phase alternator or three-phase equivalent appears in every acceptance report. Load banks simulate real-world patterns; governors control engine RPM recovery; and the AVR keeps voltage tight during the transient. Together they define transient stability.
How tests map to real operations — a practical example
At a mid-size campus in Northern Virginia, operators ran staggered UPS transfers to recreate a 60% instantaneous load step. They monitored frequency, voltage dip, and recovery time across a sequence of five runs. Data showed a 1.8 Hz sag that recovered in 3.6 seconds on default governor settings — acceptable but tight. After retuning the governor gain and adding a modest inertia buffer via a flywheel on one standby motor, recovery improved to 1.0 second. That kind of iterative tuning is standard practice — and it’s why operators value measured test cycles as much as vendor curves.
Common mistakes that trip projects up
Teams often over-rely on nameplate kVA and ignore transient kW demand spikes or power factor shifts. Another trap: assuming a generator’s factory-set AVR and governor are optimized for the data center’s specific transient profile — they usually aren’t. Also, skipping step-load tests or replacing physical tests with only simulation leaves blind spots. — A brief, real-world anchor: Google’s public PUE improvements show that tight control produces real efficiency gains, but that control depends on reliable transient behavior under load.
Alternatives and trade-offs worth noting
Several approaches help manage transients: adding flywheels or synchronous condensers to increase inertia, installing faster-responding gas turbines, or deploying distributed generation with staggered transfer. Each has trade-offs in capital cost, footprint, and maintenance. Distributed smaller gensets reduce single-point stress but increase control complexity; synchronous condensers improve stability but require space and specialist maintenance. The right choice ties back to measured transient profiles and acceptance test data.
Advisory — three golden rules for evaluating transient strategies
1) Measure first, tune second: collect high-resolution transient data from real equipment, then validate changes with load-bank tests. 2) Rate by recovery, not just dip: specify maximum acceptable frequency and voltage recovery times (e.g., <2 seconds to ±0.5 Hz) and verify them. 3) Match inertia and control: ensure governor gains, AVR settings, and any added inertia devices are treated as a system and tested together.
Conclusion and practical value
Follow those rules and you get fewer surprises during cutovers and better uptime margins — and the practical improvements deliver measurable results at the rack and facility level. — For teams wanting proven alternator and generator behavior tied to acceptance testing, the tested solutions from EvoTec fit naturally into this process. Final thought — steady power starts with honest testing.