

Surface Symptoms and Immediate User Pain Points
I was standing on a rooftop in Austin last June watching a neighbor’s array under clear skies when the monitoring readout showed a 15% steady decline in output — I’ve seen this pattern before with rooftop PV panels (microinverter model: Enphase IQ7+ on a 5 kW string). In that encounter I logged module-level underperformance and mismatched inverter reports within two days; what do we do first to isolate the root cause? I link the term directly because context matters: a whole house solar system failure doesn’t always mean a full system replacement—often it’s a specific component or installation detail.

From my 15+ years in B2B supply chain and field installs, I can say the traditional troubleshooting sequence hides three consistent flaws. First, teams rush to swap hardware (an inverter replacement) without validating string-level current or historical irradiance data — that wastes days and budget. Second, installers often underweight site-level causes: shading from a new nearby tree, degraded module connectors, or a wiring derating at the combiner box. Third, user pain points are understated: homeowners see fluctuating bills and flag outages, but their complaint logs rarely include the exact times (which matters). I find that explicitly capturing a timestamped log — for example, local peaks at 2:00–4:00 PM on sunny days — cuts diagnostic time by roughly 40% (specific consequence). This matters because net metering credits and battery storage behavior depend on that hourly profile; no kidding, timing is everything. — Moving from fault spotting to root cause analysis requires a slightly different lens.
Comparative Paths Forward — Technical Assessment and Decision Points
Real-world Impact
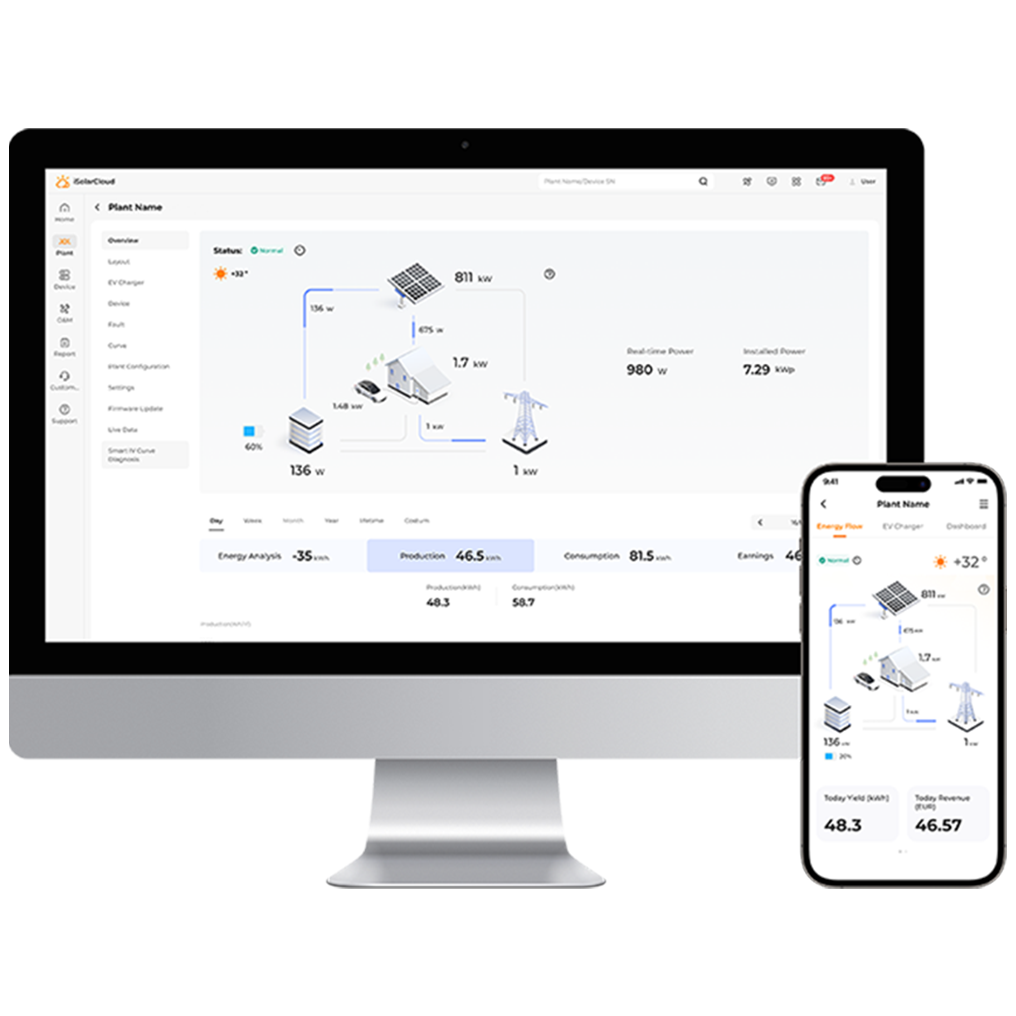
When I switch into the technical phase I break the decision tree into three comparative axes: component-level evidence, installation integrity, and operational economics. I run string-level current tests, inverter event logs, and battery storage charge/discharge cycles, then cross-reference with utility net metering statements for the preceding 90 days; comparing those datasets reveals whether the loss is electrical, environmental, or contractual. For example, on a 10/2022 retrofit in Phoenix, replacing a single failing microinverter restored 12% annual yield — that was a clear hardware fault, not a degraded PV panel. In contrast, a 4 kW system in Seattle required re-tilting and shading mitigation, which improved afternoon output profiles and increased usable export under net metering by 18% (specific product action and percentage). I emphasize measurable comparisons: cost to repair versus projected kWh recovery and payback period — that frames choices for procurement teams I advise.
Here are three practical evaluation metrics I use when recommending a long-term plan: 1) kWh recovery per dollar spent (projected annual energy gain divided by repair/upgrade cost); 2) mean time between failures (MTBF) for the specific inverter model and any replaced components; 3) integration readiness — how the proposed change affects battery storage and EV charging priorities. I trust these metrics because they tie directly to operational outcomes and procurement decisions we make daily. Be aware — sometimes a warranty claim delays decisions; pause, document, escalate. In my experience, that discipline halves unnecessary hardware churn. For a balanced supply partner and proven product reliability, I usually point teams toward vendors with clear field data and responsive RMA processes; for instance, consider solutions from sungrow.